StayingSustainable.com
Actual Power Generated from a 10kW Solar Installation
We are happy to introduce to our audience, a different way of investigation solar power outputs. In considering solar power, it is often difficult to understand how the size of a solar installation translates into actual kilowatt-hours generated, which is how your power bill is metered. Most often you will hear the estimates of peak performance, and even then, you can’t really translate that to your power bill because it depends on how many hours of the day the panels are operating at peak performance.
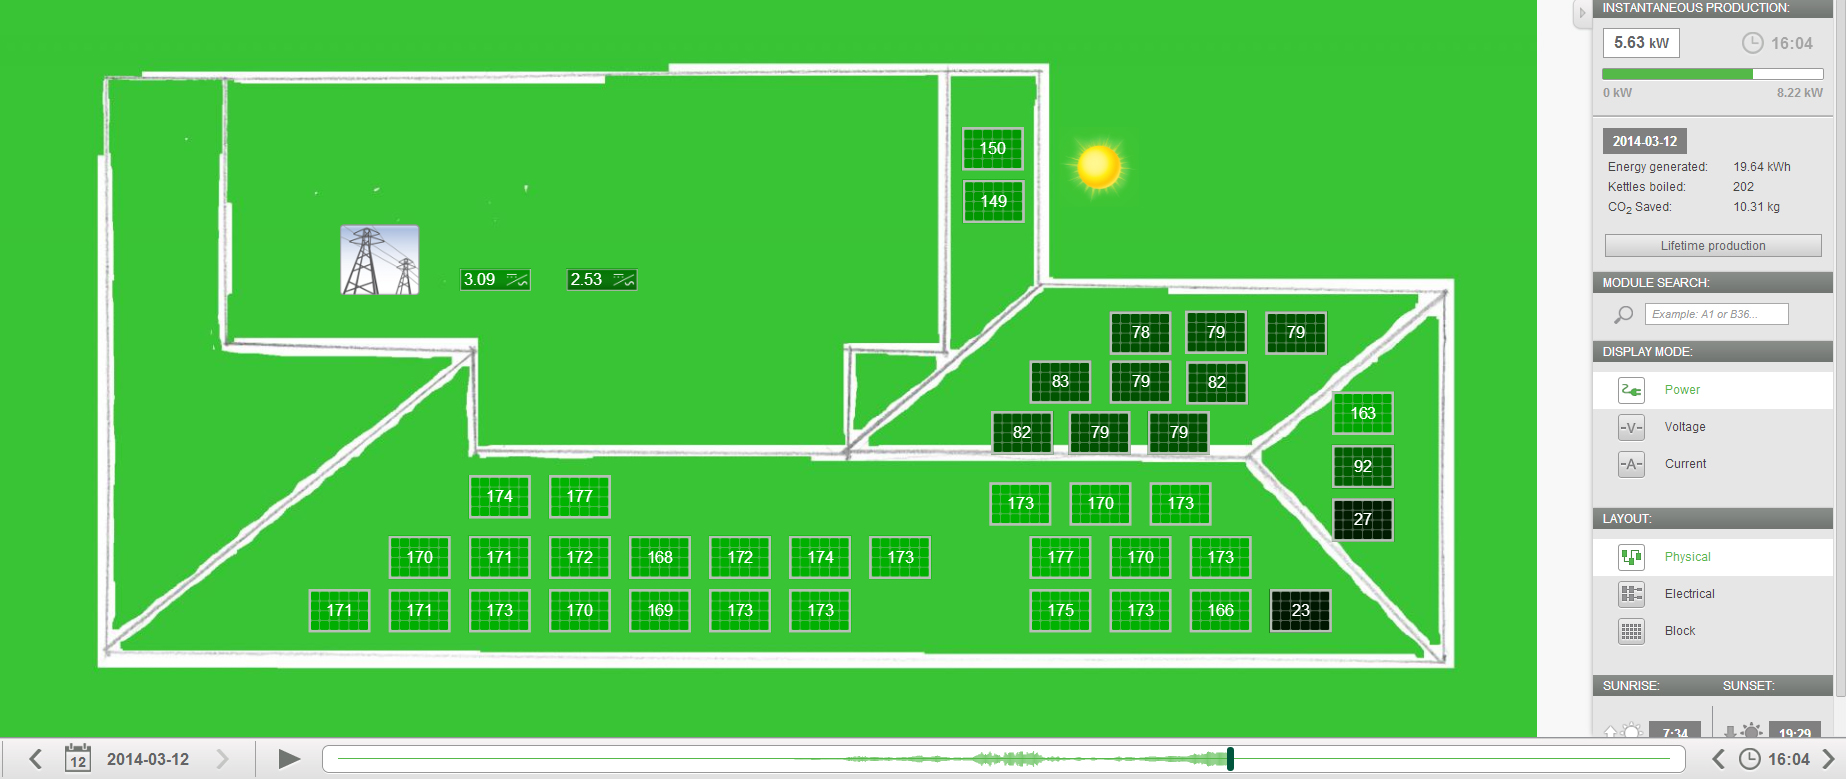
So what do you do? If you are like us, you probably want to see the data for yourself. So that is what we will do. We have been granted unique access to the output data of a 10kW residential solar installation in Brevard County, Florida. Using the information we acquire, you will be able to see what kind of power the system puts out on a day to day basis.

Now, there are a number of things that you will need to considering when analyzing this data. There are several factors that make this system different than an optimally operating system. For instance, because of the layout of the home, the 40 panels that were placed on the home had to be arranged such that only five faced south (which is what will provide you with the most efficiency), while nine faced east and 26 faced west. So right off the bat, the data you will receive is less than what you would see if you were able to put all 40 panels on a southern facing roof.
Unfortunately, we cannot gather all of the information available from this system, because it would just require too much memory. The system is very complex and can provide many various types of information. We will go into that on the next page, but for those of you who just want the data, grab it from the link below. This information will be updated periodically as a PDF until we are able to link a fair sized database to the site. Until then, enjoy your investigation!